How to Personalize Power BI in Your Customizable Reporting Environment?

Branding, company colors, logos, the right visuals, custom images. When you make a report or dashboard, you want it to look right. You want your insights to be visualized clearly so that people can see at once what the status or trend is that the data behind it implies. Power BI has many options when it comes to visual types. From a basic bar chart to 600+ custom visuals available in Microsoft Appsource.
Let’s take it one step further and really make it your own. Towards a customizable reporting environment!
Before we learn what is possible, it is useful to understand why the theming and branding of reports and the environment around it is important. Why you should spend some time on it and what it can bring in added value if you do.
What branding brings
Branding is not just a logo or a color palette; it is the direction and the feeling you want to convey to your organization. It radiates your identity, builds trust, and creates a connection with your target audience. But also within your organization branding is important, which means the tools you use for internal and external reporting should also be branded properly if they can. Here are some reasons why you should spend time on branding the applications your organization uses:
Here are some reasons why you should spend time on branding. By using a consistent style, colors, logos, tone, and such:
- It makes your organization recognizable
- There is consistency and therefore less confusion
- It makes your organization come across as trustworthy and professional
- It brings people together. Not just employees who work for your organization, but also customers, partners, suppliers, and other stakeholders will become part of the environment that has your identity.
Good branding within your organization ensures recognizability, consistency, a professional appearance, motivation and pride among your employees, and a strong market position. The use of applications in your own brand can strengthen these benefits and contribute to the overall success of your organization. So, if you’re wondering whether it’s worth investing in custom-branded applications, the answer is a resounding yes!
Customization and theming options in Power BI
Power BI already has a lot of options to theme, brand, and customize reports and dashboards. You can set up themes to use in reports to be sure your branding is consistent. Just check out this Microsoft Learn article.
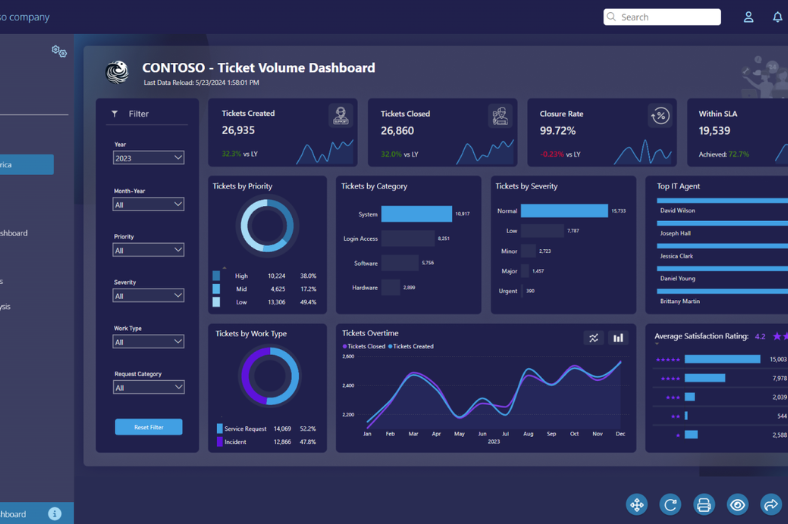
In Power BI Service, with the correct admin rights, you can add your own logo and edit colors of the header and side-menu, as you can see below.
There are many more tips and tricks to find to customize the reports themselves. And our (Power) BI-specialists are always happy to take a look at your dashboards and reports how they can be improved further, both the Front-end and Back-end.
But as we’ve seen time and time again: you’ve made your pretty report. You have spent a lot of time on the right visuals and company colors… Now what?
The next step; a custom portal to truly make it your own
The basics in Webdashboard:
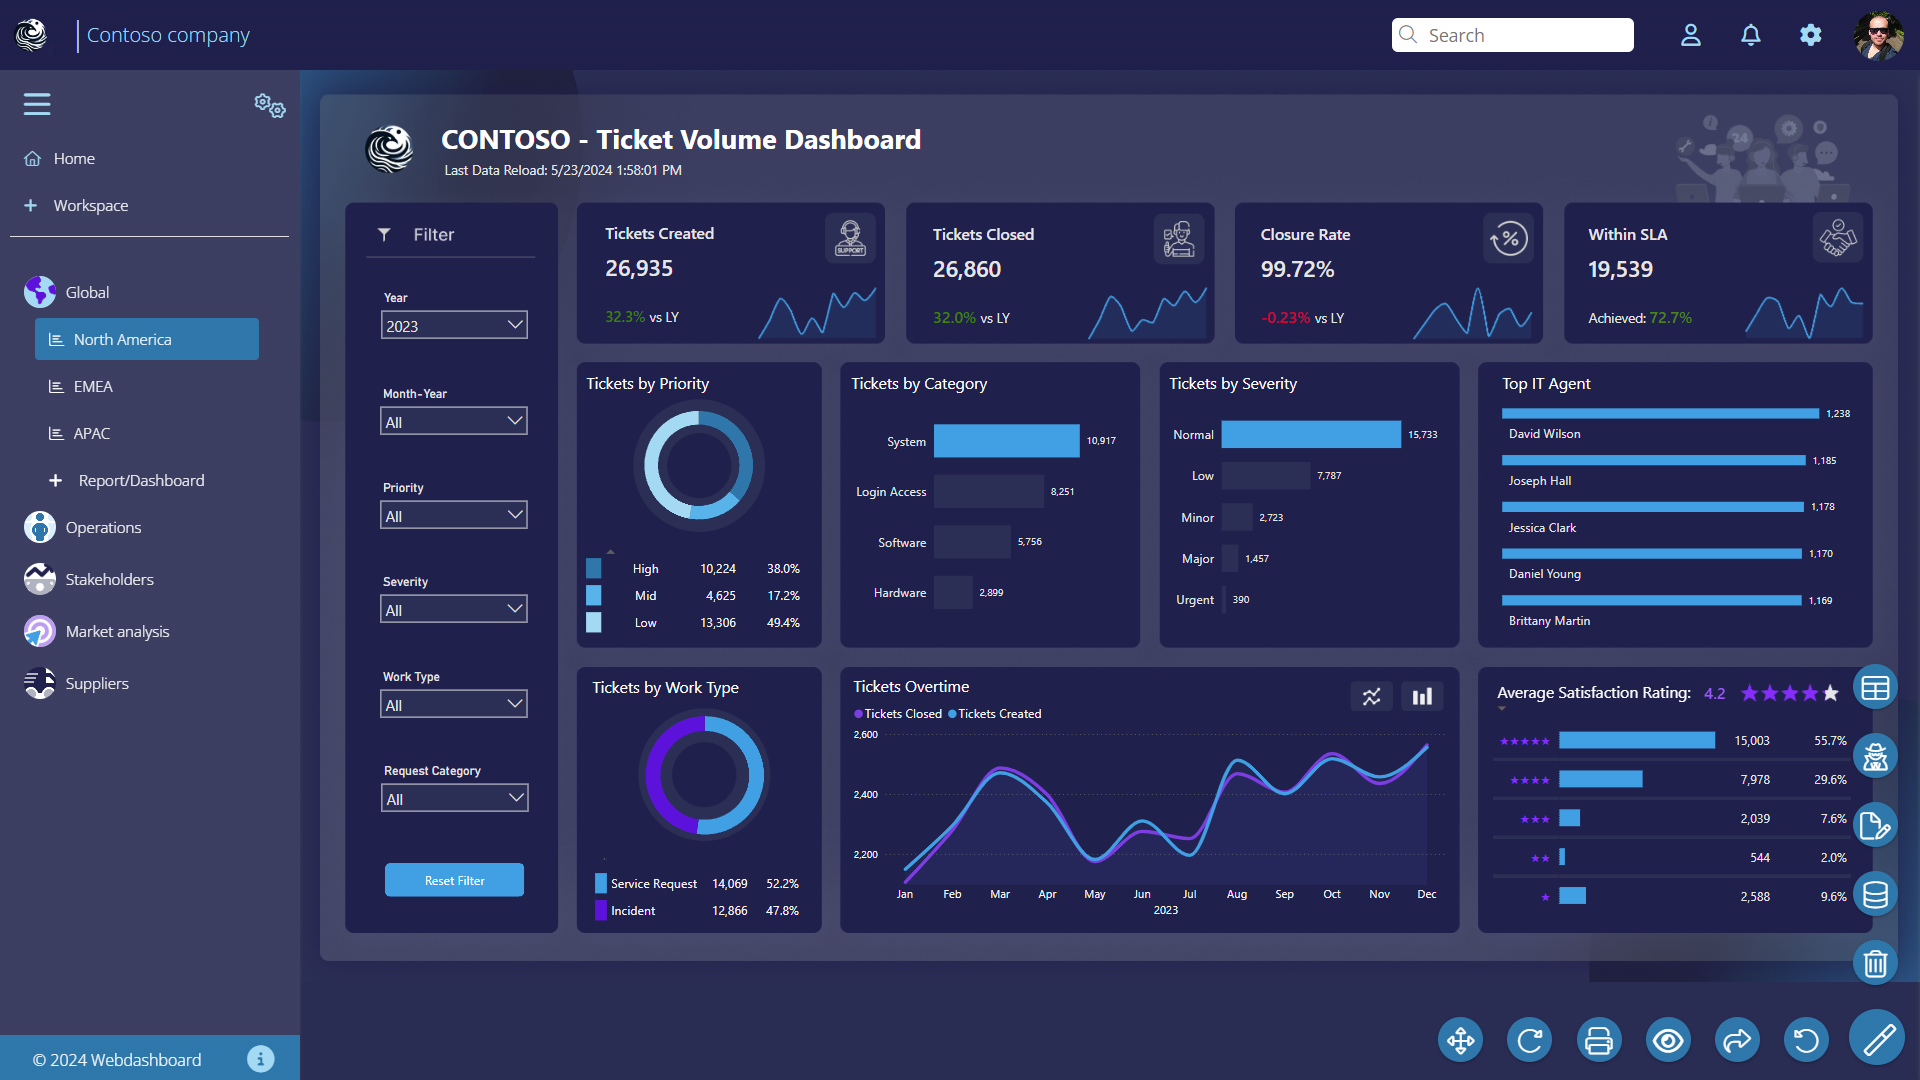
With a reporting environment like Webdashboard, you can go beyond branding. Just like in Power BI, you can customize colors of the header, side-navigation menu and add a logo. But these are just the basics. You can customize colors of buttons, text, icons, backgrounds, etc. If you want to take it one step further, you can customize the ‘badge’ of a workspace. This can be useful, if you for example use one Webdashboard environment to share consultancy dashboards with multiple companies. As you can read in our blog on management of reporting in Webdashboard, you can use ‘Workspaces’ to give each customer their own reports. You can customize the badge of each workspace with the logo of the customer. This way, you can use both your own logo at the top, but still add recognizability for your customer.
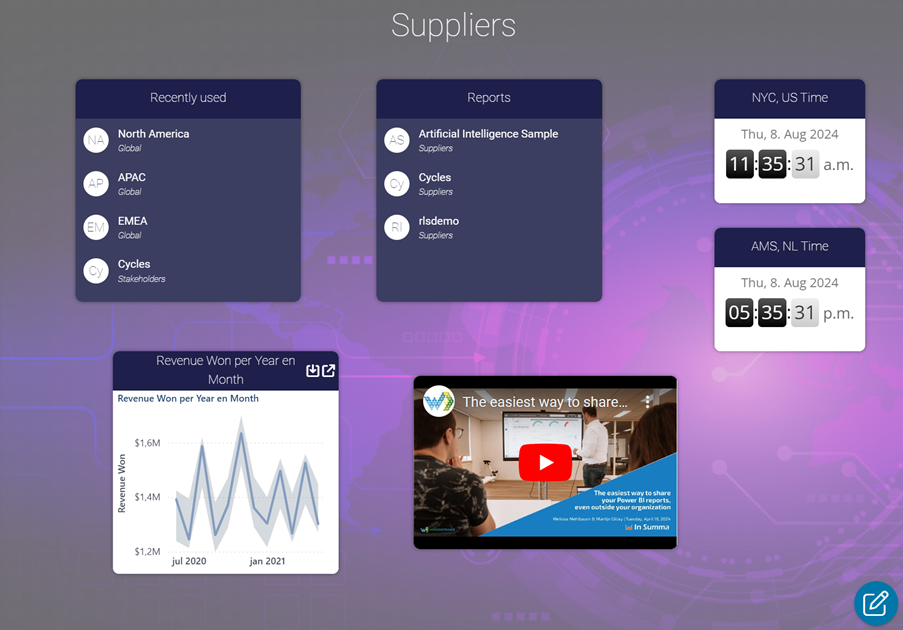
Workspaces & widgets:
On a workspace, you can also customize the ‘Workspace homepage’. On both the homepage of your portal (which is available for everyone in the portal), as well as the Workpace homepage, you can add several ‘Widgets’ to add elements to your environment. We’re now entering into a bit of storytelling around your data.
- Reports: you can select to showcase quick-links to several reports, also to reports in different workspaces
- Favorites: you can select a few favorites to showcase as quick-links, also to reports in different workspaces
- Text & Link: use this widget to post a general message, instructions, a story, add pictures, etc.
- Report visual: you can showcase a specific visual from a specific report, to which you can quickly navigate. In this way you can create a dashboard from multiple reports.
- Recently used: showcasing which reports you have recently accessed, so this can be different per user
- Slideshow: quickly navigate to slideshows which an admin can create. For example for a meeting, or for broadcasting purposes, you can create a slideshow from different reports and tabs.
- External content: embed external links, like a weather forecast, a video from youtube, a social media feed, or whatever can be embedded.
If you gather all these possibilities, you can easily create something like below:
Whitelabeling:
If you want to go even one step further, you can completely whitelabel your environment. So that your users don’t have the feeling that they’re using Webdashboard. Instead, they navigate to: insights.yourawesomecompany.com, and see a reporting environment that is completely customized and recognizable to them in the style of your company. You can customize the url, login-screen, custom fonts, and even e-mail communications.
Of course, you need to link to this custom domain, but our team can easily help with it and establish it in a few minutes. Some of our current customers use Webdashboard in this way, coupled with their internal already existing environment. Their users don’t know that they are using an external portal called Webdashboard. To them, accessing insights and reports, is integrated into the environment they are already familiar with. In our opinion, it is still about getting a user/viewer/consumer to their report and insights in the way that is for them easiest. If that means sacrificing the branding of Webdashboard as a product, and replacing it with your custom company branding, that’s only something we’re excited about!
Ready to make it your own? Start your 30 day free trial with Webdashboard at: https://webdashboard.com/register/