How to effectively manage your reporting environment and usage

Management may be one of your main responsibilities, but you of course want to spend time on managing the right things. In this blog, you will read how you can effectively manage your Power BI and reporting environment (including usage) via Webdashboard.
You want to make sure everyone gets access to the right reports and dashboards, but only those they are allowed to see. At the same time, you don’t want to have to rely on IT everytime you need to add a new user.
Here is what we’ll cover in this blog ‘How to effectively manage your reporting environment and usage’:
- Why is it important to manage your environment effectively? (Rather: what happens if you don’t?)
- How to manage Reports & Dashboards
- How to manage Users & Groups
- Not just for you, also for your users
Why is it important to manage your environment effectively?
It sounds almost too obvious. Managing reporting should be part of the tasks of any BI specialist or their manager. But in reality, the daily grind of operations catches up with you. In the same way, it works as with regular work files in your file explorer or with folders in OneDrives and Sharepoints. Especially when you go for external sharing of data. Within your organization you might have things in order, but outside your organization certain things will also be outside your control. So you need to be aware of the challenges that come with reporting management:
- Data Silos: Reports scattered across various departments, teams, and even different organizations.
- Access Control: Ensuring the right people have access to the right reports while maintaining security. Especially people outside of your organization.
- Performance Monitoring & User Engagement: Keeping track of report usage and performance so that it can be improved where needed. Ensuring stakeholders are using and continuously benefiting from the reports.
So why is this important? Think about what potentially can happen if things are not managed properly.
- Data Silos: This may lead to different versions and inconsistent data. If different stakeholders are working with different versions of reports, it results in either misalignment or worse: mistakes.
- Access control: If this is not managed properly, it may be that reports with confidential data are being shared via e-mails or something, ending up God knows where. Or, people who have left their company or a project, who somehow still have access to insights they should not have. IT has to spend a lot of time to keep things updated (and you have to spend a lot of time communicating with IT what to update).
- Performance monitoring & User Engagement: How would you know how your reports are performing, if you don’t even know if people use them in the first place? It could be your report is amazingly insightful, but people are simply not using it because they cannot or have difficulties finding it. Or the other way around, because your report is not representing or relating properly to what is expected, or it’s confusing, so people don’t use it. You cannot always influence what the contents are and the conclusions that people draw from the insights. But these are part of your responsibility as soon as you click ‘Publish’ and present a report online. So it’s not just the delivery of the report and you’re job is done. Your (reports) consumers should be satisfied, and you only know that once you have a good review.
In other words: you lose control over what should be your main focus: reporting.
Luckily, in Webdashboard it is easy to set up a structure that is manageable. Of course, there are many more possibilities and things to cover, but for now, let’s look at the basics you need to get started.
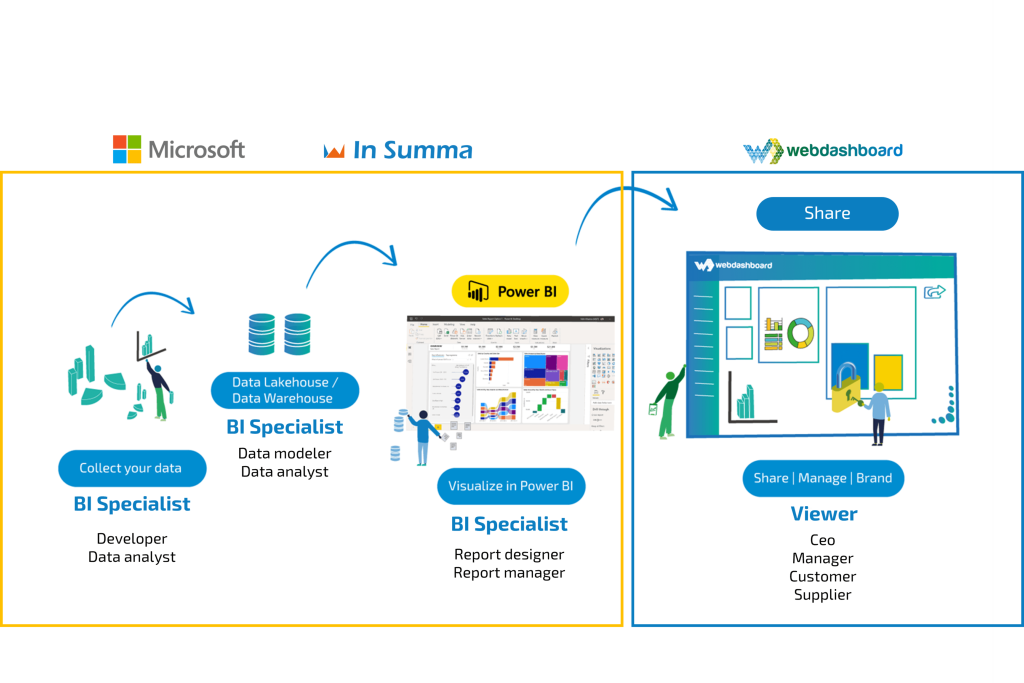
First, some terminology. In Webdashboard you have two types of roles. Admins, people like yourselves (Hi there👋), who set up the portal and manage everything. They usually have knowledge of (Power) BI and know about reporting, structure and/or security. They can be a BI-er or a Head of Insights or a manager of data and infrastructure.
The other role is a user. Users are actually the end-users, in other words the consumers/viewers of your reports. The viewer, or in Microsoft’s terminology: the consumer or ‘business user. The audiences looking at the reports during meetings, and decide what should be changed based on these insights. This can be a customer, a supplier, an employee, a partner, or a manager, etc.
How to manage Reports & Dashboards
Once you have signed up for Webdashboard and started your 30-day free trial, you can immediately start setting up and customizing your environment.
It starts by setting up Workspaces. These can be for example division based: Marketing, Sales, Finance, Engineering, HR, MT, etc. Or, they can be names of different organizations you’re collaborating with; Customer A, Customer B, Customer XYZ, or region or country-based. They can be a combination: Suppliers 1-5, Logistics teams 1 & 2, and assembly lines 1 – 3. You can change this as your organization or collaboration grows. You could use a workspace for each project, and simply delete it once the project is completed.
To these workspaces, you will add your reports and dashboards. You can add a report to different workspaces. You can work with RLS to cleverly make use of one report for different audiences (we’ll explain that in a different blog). You can also temporarily close a report if you ever need to edit and update it. And if you work with refresh schedules, you can ensure your users are working with the latest.
TIP: use RLS to use one report for multiple audiences
On the topic of users, now that you’ve set up your structure, it’s time to discuss the management of the users.
How to manage Users & Groups
There are various ways to add users to Webdashboard. The basic way is to just add them with their e-mail address. But to make life easier, you can also couple Entra (previously Azure AD), or Google Workspace Identity providers. This allows users to login with their familiar work account. Once you couple one or multiple Entra, it is just the coupling, so not automatically everyone is added as a Webdashboard user. If you want to add users in bulk you can import a csv. If you want to take it one step further, there is also a Dev API you can use to automate processes.
For each user, you can decide which workspace(s) they get access to. Also whether they should land on a specific workspace or the homepage after they login, Of course it is also easy to remove a user. No need to go to IT anymore – you’re in control!
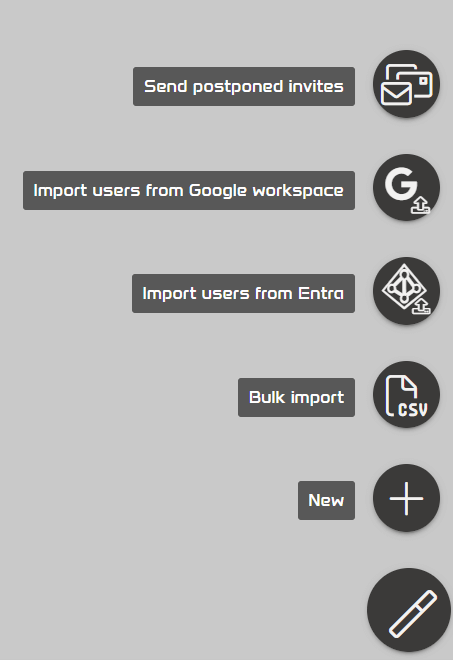
Adding a user is easy: you just need their e-mail. You can make your life easier by coupling identity providers.
What many of our customers do to make things even easier: they make Groups and divide their Users amongst these. Groups can be similar to your Workspaces. They for example make a Workspace for each customer they want to share with. They then use a single report with RLS to show the different insights for each customer. They then make Groups per customer (each Group gets access to their own Workspace) and simply add the stakeholders to the Groups. Now all they have to manage is keeping these Groups updated with the right users. Removing people who leave and adding people who join these companies. Like this, there are several of our customers using Webdashboard, at which only a handful of admins can manage hundreds of users easily on their own. Again – without being dependent on IT or licensing.
TIP: Couple Identity providers like Entra or Google Workspace. This makes it for both you and your users easier
TIP: Divide your users into Groups, so that you only have to manage these
Not just for you, also for your users
Half a working day each week is lost on operations being lost. Various studies have shown that employees spend on average an hour a day looking for information. Switching between platforms, tools, and versions. Since the pandemic, the amount of info has only increased, so this hour a day may well be more by now.
Imagine you’re an end-user, a marketing employee or manager at a supplier. If you’re not familiar with Power BI, you can easily get lost or spend a long time looking for the right place and info. Webdashboard focuses on these users who are not familiar with Power BI. But admins will be able to set up a structure that is more user-friendly for this end-user. If it is set up right, an end-user can be at the right insight within two clicks. We’ve disabled or hidden any functionality that they should not need access to. You can see an example of the differences below.
A difference in focus. Webdashboard is there for the end-user, the viewer, or consumer of reports.
Admins who set up and manage the reporting environment, can edit whatever they want or need to, as seen in the previous examples. They can also customize the portal (read more about branding and customization options in a different blog). But regular users should not be able to delete a report, nor should they be able to accidentally alter any underlying data, or change anything in the environment. Most users in fact, don’t even like to be bothered with all kinds of settings and unnecessary steps and clicks. 😉
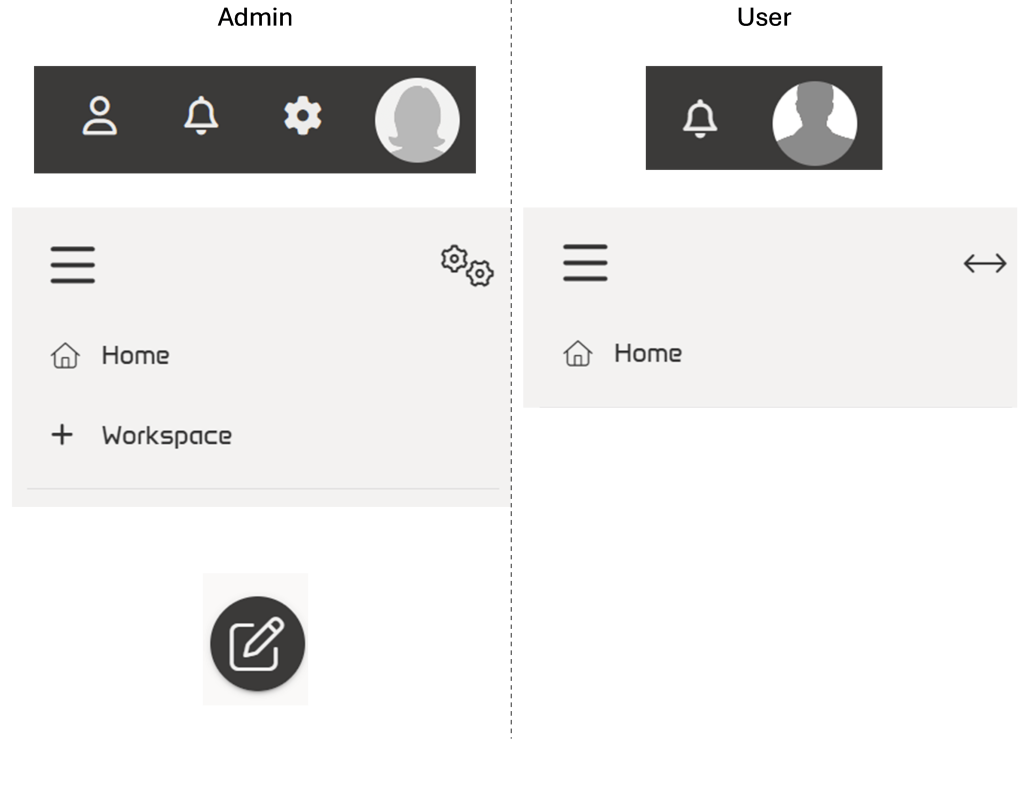
Some of the differences between admin functionalities and user functionalities. Less clutter for users!
TIP: Keep your users in mind! Ensure they are at the right insight within two clicks.
Be sure to keep your (end)user in mind when you’re managing the structure of reports and workspaces. Don’t just ask them for feedback on the contents of the report, but also ask for their feedback on the environment. If people cannot easily find what they’re looking for, they’re not going to use it.
As an admin, you can easily monitor usage and performance. You can see for example which users look at which reports, or which users rarely login. You can see which reports perform well. Even more important: which reports don’t. Use these insights to your advantage. Speak with consumers about what they like and do not like. Why do they use a report often or rarely? Ask what they might miss, let them know you’re open to improvements, and what they should do if they spot a mistake (it happens to the best). Because don’t forget: a report that is not viewed, let alone used, is not a report!
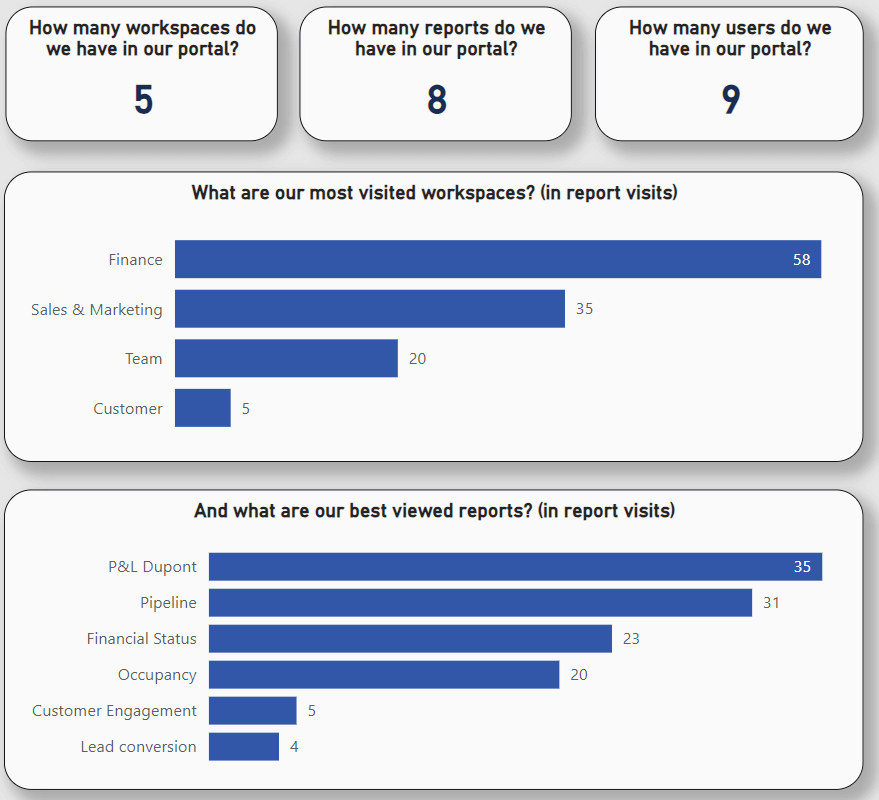
Get insights in your reporting environment with portal, user, report and performance insights
In short, the strong combination of Power BI & Webdashboard allows you to effectively manage your reporting environment and usage. Whether you have a lot of users and reports to manage or not, it’s something that should be simple in any case. And not just for you, but for everyone who deals with reporting and reports.
But don’t trust our words and examples for it, go experience it yourself. Start your free Webdashboard trial and test it out for 30 days.